Creating Accessible Tables in Canvas
This guide is designed for instructors creating course materials in Canvas. Following these steps will help ensure tables are accessible to students who use screen readers, keyboard navigation, or other assistive technologies.
1. Use Tables Only for Data (Not Layout)
✓ Use tables for:
- Schedules
- Rubrics
- Comparisons
- Structured data
× Avoid using tables for:
- Page layout
- Spacing or alignment
- Visual design elements
If the content is not truly tabular, use headings, lists, or paragraphs instead.
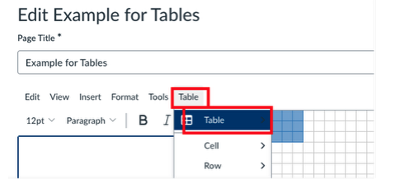
2. Create Tables in Canvas Using Built-In Tools
Always insert tables to Pages, Assignments, Discussions, etc. using the built-in tool.
- Go to the Rich Content Editor → Table.
- Select the number of rows and columns.
When creating tables, do not:
- Draw tables manually
- Paste tables as images
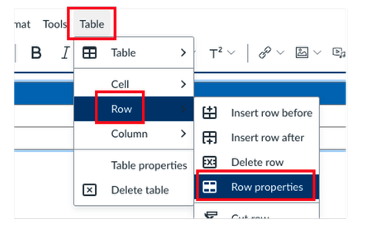
3. Identify Header Rows
Header rows tell screen readers how to interpret the data.
To set a header row in Canvas:
- Click anywhere in the table.
- Select the first row (the header row).
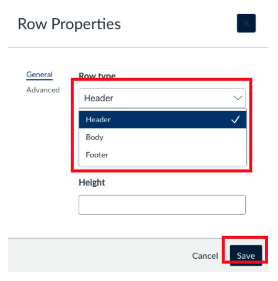
- Go to Table → Row → Row Properties
- Select Row Type → Header
- Select Save
✓Use clear, descriptive labels (e.g., "Assignment," "Due Date," "Points")
4. Keep Tables Simple
Screen readers read tables cell by cell. Complex layouts increase cognitive load.
Best practices:
- Use a simple grid (rows and columns)
- Avoid:
- Merged or split cells
- Nested tables
- Empty rows or columns for spacing
If your table is becoming complex, consider breaking it into multiple smaller tables.
5. Avoid Blank Cells When Possible
Blank cells can cause confusion for screen reader users. Instead:
- Add text such as "N/A" or "Not applicable"
- Ensure every cell has meaningful content
6. Use Accessible Formatting (Not Visual Cues Alone)
Do not rely on color, bold, or position alone to convey meaning.
✓Combine formatting with text labels
Example: Instead of only coloring required items red, also label them as "Required" in text.
7. Ensure Logical Reading Order
Word tables read left to right, top to bottom.
Before finalizing:
- Read across each row to ensure it makes sense
- Confirm that headers align logically with their data
8. Add Table Titles or Introductions
Introduce the table with a brief sentence before it appears.
Example:
Table 1 outlines weekly assignments and due dates for the course.
This provides important context for screen reader users before they enter the table.
9. Check Accessibility Using the Canvas Accessibility Checker
- Go to the Rich Content Editor → Accessibility Checker
- Review any issues related to tables
- Follow the suggested fixes
Accessible Tables in Canvas: Quick Summary
To make tables accessible in Canvas:
- Use tables only for data, not for layout or spacing.
- Create tables using the Rich Content Editor table tool, not pasted images or screenshots.
- Set a header row using the table properties so screen readers can identify column headings.
- Keep tables simple—avoid merged cells, nested tables, or complex layouts.
- Avoid blank cells; use text like “N/A” when needed.
- Don’t rely on color or formatting alone to convey meaning—use clear text labels.
- Add a brief sentence before the table explaining what it shows.
- Use Canvas’s accessibility checker to identify and fix table-related issues.
Accessible tables improve readability and navigation for all students, especially those using screen readers or keyboard navigation.